Introduction
During my time at IonQ, I found myself involved in many projects surrounding the optimization of the negative Silicon Vacancy (SiV) centers that make up the basis of our diamond devices. While Atomic Layer Etching was by far the biggest process we developed, I noticed a simpler, more overlooked problem that was consistently bottlenecking our device performance- graphitic contamination.
The first step in creating an SiV center involves the insertion of silicon into vacancies within the diamond lattice created by helium ion bombardment via any number of deposition techniques. The activation of these centers, however, is far less trivial, and must be done via high temperature annealing of the diamond. This anneal has the unfortunate side-effect of forming an unwanted graphite layer on its surface, inevitably diminishing the performance of our diamond devices. At the time, our approach to addressing this graphitic contamination had been rudimentary at best- we'd observed that multiple cycles of Triacid cleaning could restore the diamond to a quality slightly worse than its original surface, but it was such a tedious and hazardous process that one cycle, let alone multiple, often took an unreasonable amount of time to complete.
This brings us directly to the goal of my Surface Characterization Project: to determine the optimal treatment process for these diamonds so as to minimize or even eliminate all traces of graphitic buildup through iterative process development.
Methods
For this task, I used various microscopy and characterization tools to examine each step of the SiV development process in hopes of finding a way to negate the downsides of the anneal step. By far the most important technique, however, was, X-Ray Photoelectron Spectroscopy (XPS)- a surface-sensitive sensing technique that makes use of the photoelectric effect to determine the material and chemical properties of a surface. When a material is irradiated by light, the incident energy of the is transferred to the surface's electrons, knocking an electron out of the surface in the event that the incident energy is higher than the bond energy. Because no two elements share the same bond energy, the results of the XPS can then be used to provide a chemical fingerprint of the materials composing the surface. In our case, because graphitic carbon (sp²) has a binding energy centered around ~283.85 eV whereas diamond (sp³) has a binding energy centered around 284.80 eV, we could theoretically use our the data from XPS Spectrum to fit peaks to the both of them for easy analysis.
Unfortunately, for us, while it’s quite easy to distinguish between pure sp³ and sp² carbon spectra, conventional peak-fitting becomes less reliable when they’re mixed on one surface. As such, I had to use something called the D-Parameter of the Carbon Auger Peak. The D-Parameter provides an alternative way of distinguishing between sp²- and sp³-bonded carbon by analyzing the carbon KLL Auger feature rather than relying solely on fitting the C1s peak. To determine it, one must first differentiate the C KLL Auger spectrum before calculating the energy difference between the maximum and minimum of the first-derivative spectrum. Because the shape of the C KLL Auger feature is strongly dependent on the electronic structure of the carbon atoms, it changes shape with the relative proportions of sp² and sp³ bonding- and it has been previously proven in literature that graphitic, sp²-rich carbon produces a larger D-Parameter, with pure sp² samples showing D-Parameter values of 23.5 eV. Sp³-rich carbon, on the other hand, produces a smaller D-Parameter, with pure sp³ samples having D-Parameter values of 13 eV.
Another tool I leveraged for this project was Atomic Force Microscopy (AFM), which proved especially useful for measuring changes in surface roughness caused by implantation, annealing, and graphitization.
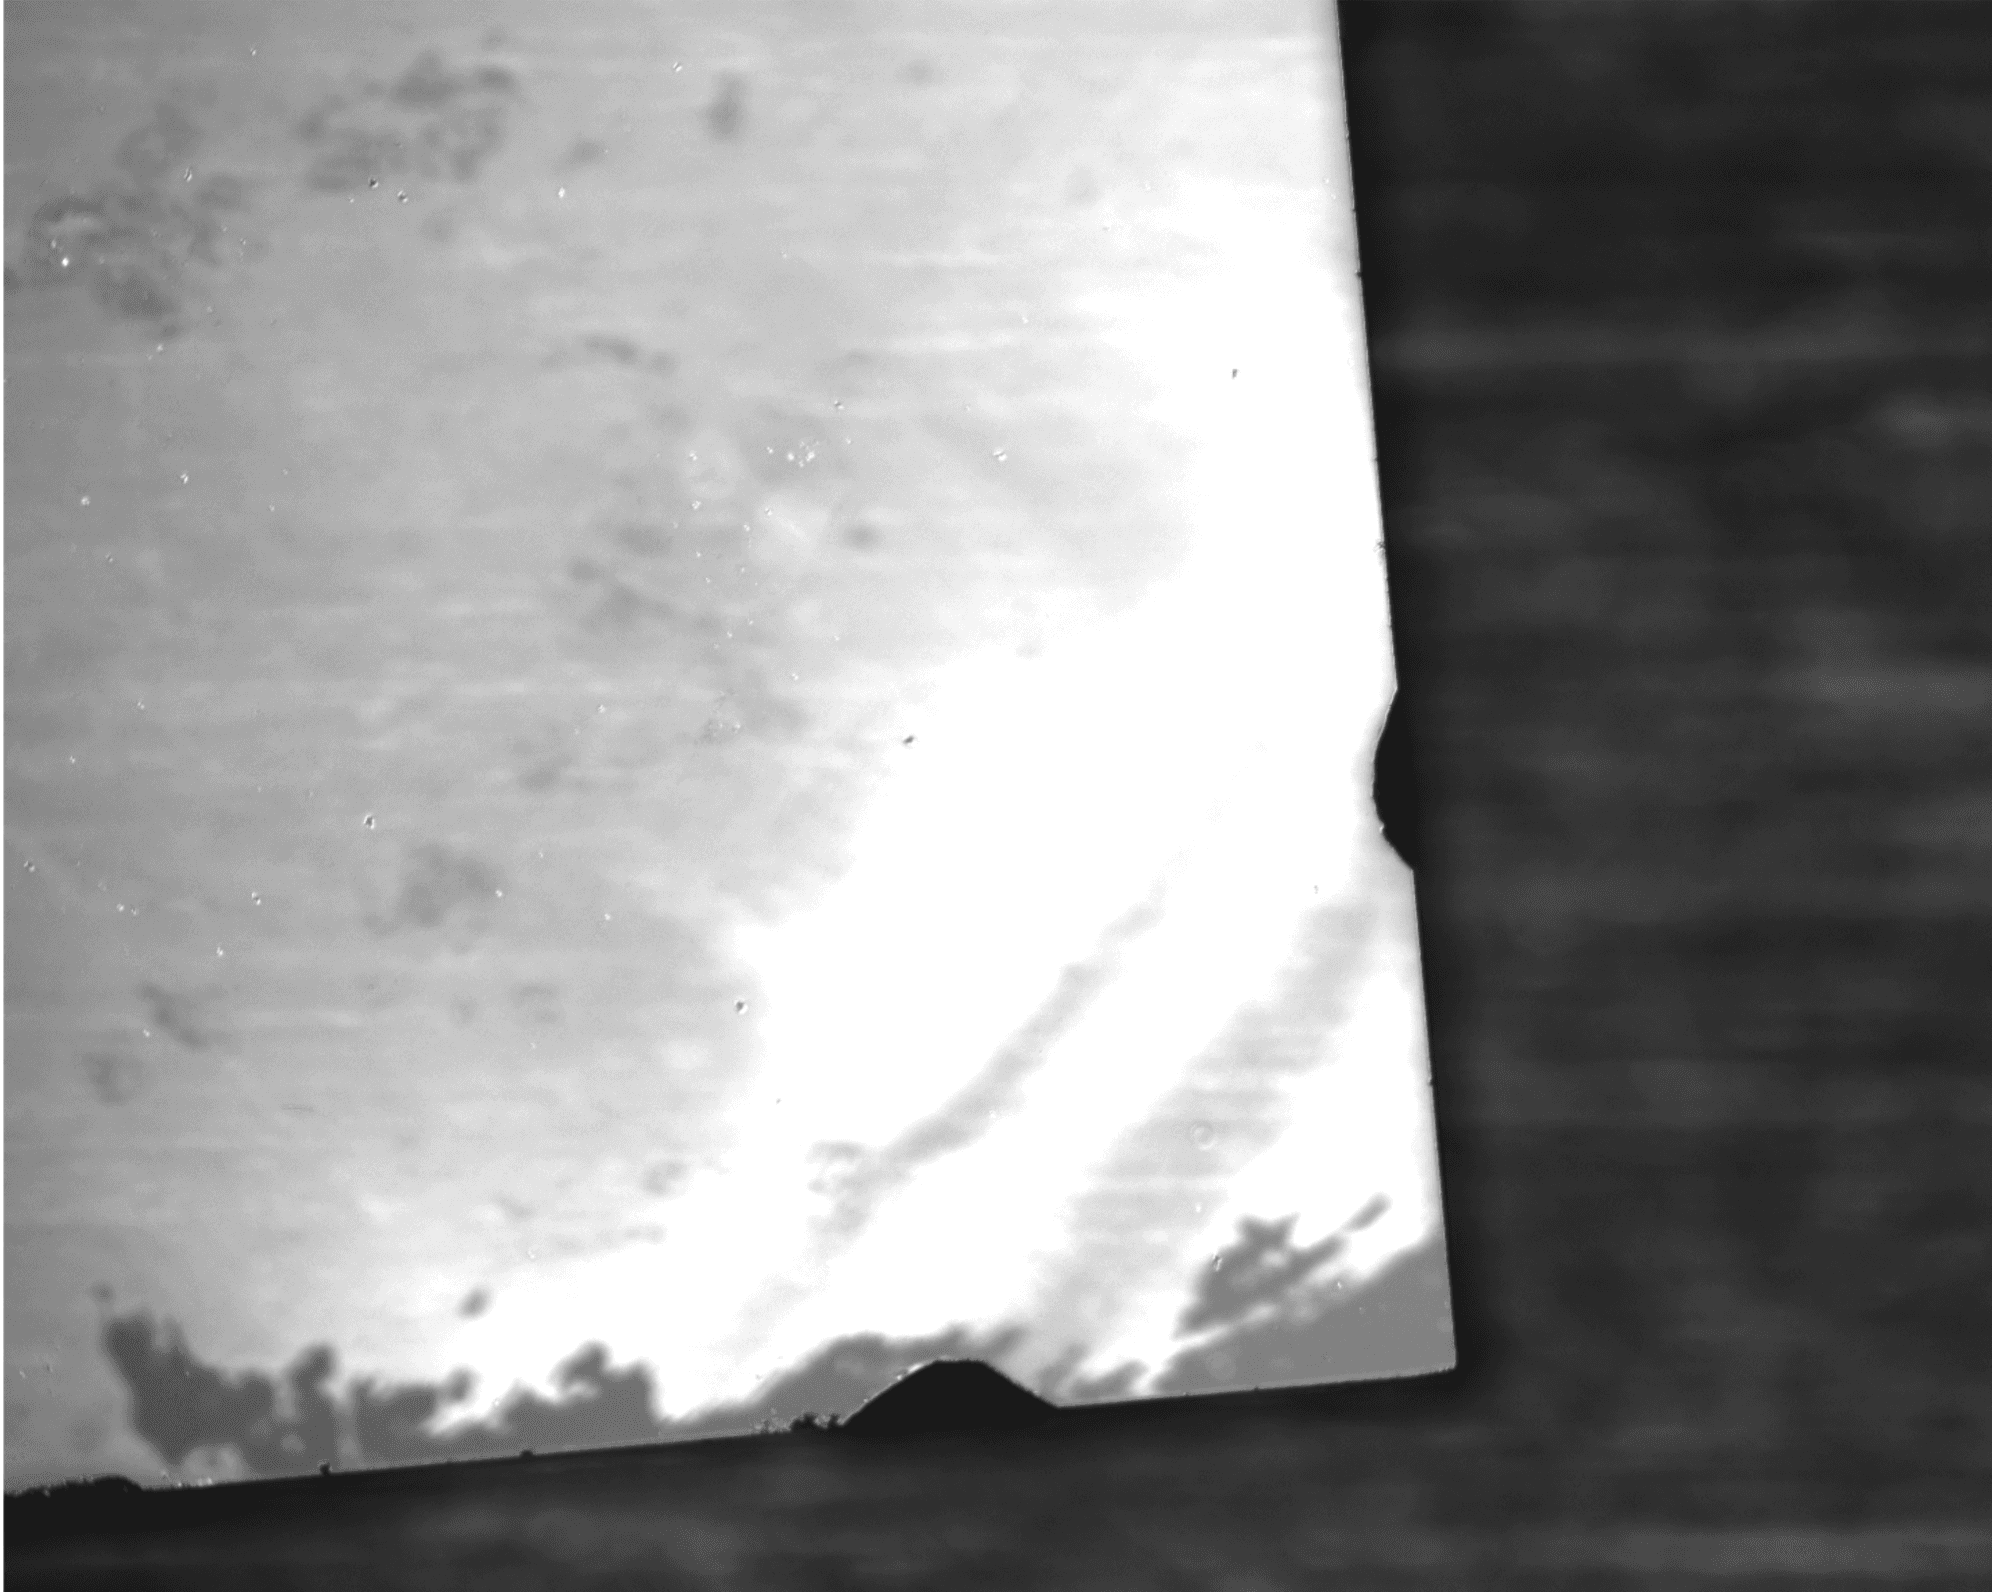
I also utilized DIC Microscopy to obtain optical images of our diamonds. These helped us distinguish between samples, ensuring that there was no mismatching between them at any step of the way.
Experiment Details
Scans were performed using Thermo Scientific K-Alpha+ (XRA-008) and Nexsa (XRA-009) systems, with the K-Alpha+ preferred for its multiplexing capabilities. All XPS scans utilized a 200 µm spot size across C1s, O1s, C KLL Auger, and survey regions. C KLL Auger settings were standardized (pass energy = 100 eV, step size = 0.5 eV, 100 scans, range 1190–1246 eV) for automated D-Parameter calculation. High-resolution C1s and O1s scans used a 0.05 eV step size across 20 scans, while survey scans were set to 10 scans.
Batch 1 (SC01 & SC02): Triacid vs. O₂ Plasma
- Baseline: SC01 started with a near-perfect sp³ surface (~1.3% sp²), while SC02 exhibited pre-existing graphite contamination (>9% sp², initial D-params ~14.5 eV and ~16.0 eV).
- Post-Anneal (1.5 Days): High-temperature annealing significantly increased graphitization on both samples. SC01's sp² content spiked to nearly 56% (D-Parameter 18.5 eV), while SC02 reached 20% sp² (D-Parameter 16.0 eV).
- Triacid Clean: Reduced sp² concentrations to 22.83 at.% (SC01) and 15.82 at.% (SC02), with D-Parameters dropping to 17.0 eV and 15.5 eV—confirming partial, but incomplete, graphite removal.
- O₂ Plasma Clean: A gentle O₂ plasma treatment dramatically cleared residual contamination, dropping sp² content to 1.73% (SC01) and 3.42% (SC02) while restoring D-Parameters to 14.0 eV and 14.5 eV.
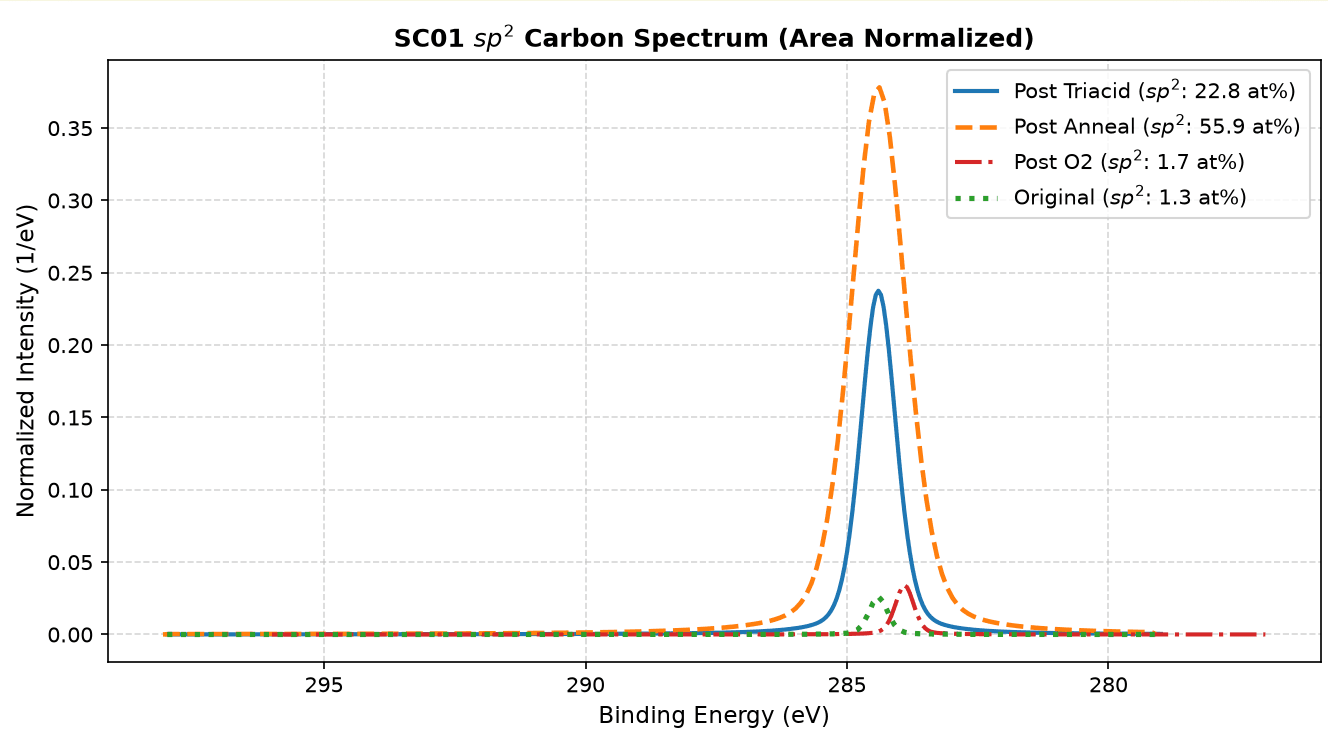
Area-normalized C1s sp² carbon spectrum for sample SC01 across baseline, post-anneal, triacid, and O₂ plasma cleaning stages.
Batch 2 (SC03–SC07): Bypassing Triacid & Plasma Optimization
To test whether Triacid cleaning could be eliminated entirely, five E-grade diamonds (SC03–SC07) were processed using O₂ plasma alone. After an initial Ar/Cl₂ clean proved to be an unnecessary misstep that increased sp² levels and surface roughness, samples were annealed (raising D-Parameters to 20–22 eV, except SC05 at 17 eV). Samples were then given varied initial O₂ plasma times: SC07 (4 min), SC03 (8 min), SC04 (12 min), SC05 (16 min), and SC06 (20 min).
- Triacid Elimination: All samples showed substantial graphite removal without any preceding Triacid clean, confirming the wet-acid step is unnecessary for anneal graphitization.
- Exposure Plateau: D-Parameters dropped to ~16.0 eV across all samples after the first clean, but increasing plasma exposure beyond 8–12 minutes yielded diminishing returns, approaching a stable plateau.
- Cumulative Clean & Spatial Mapping: A second 20-minute O₂ plasma treatment (cumulative 24–40 min) confirmed the plateau effect. Replicate multi-point scans (2 post-1st clean, 3 post-2nd clean) were averaged to account for local spot-to-spot non-uniformity. Thermo Avantage software standardized C1s sp³ carbon at 284.8 eV and sp² carbon at 283.85 eV.
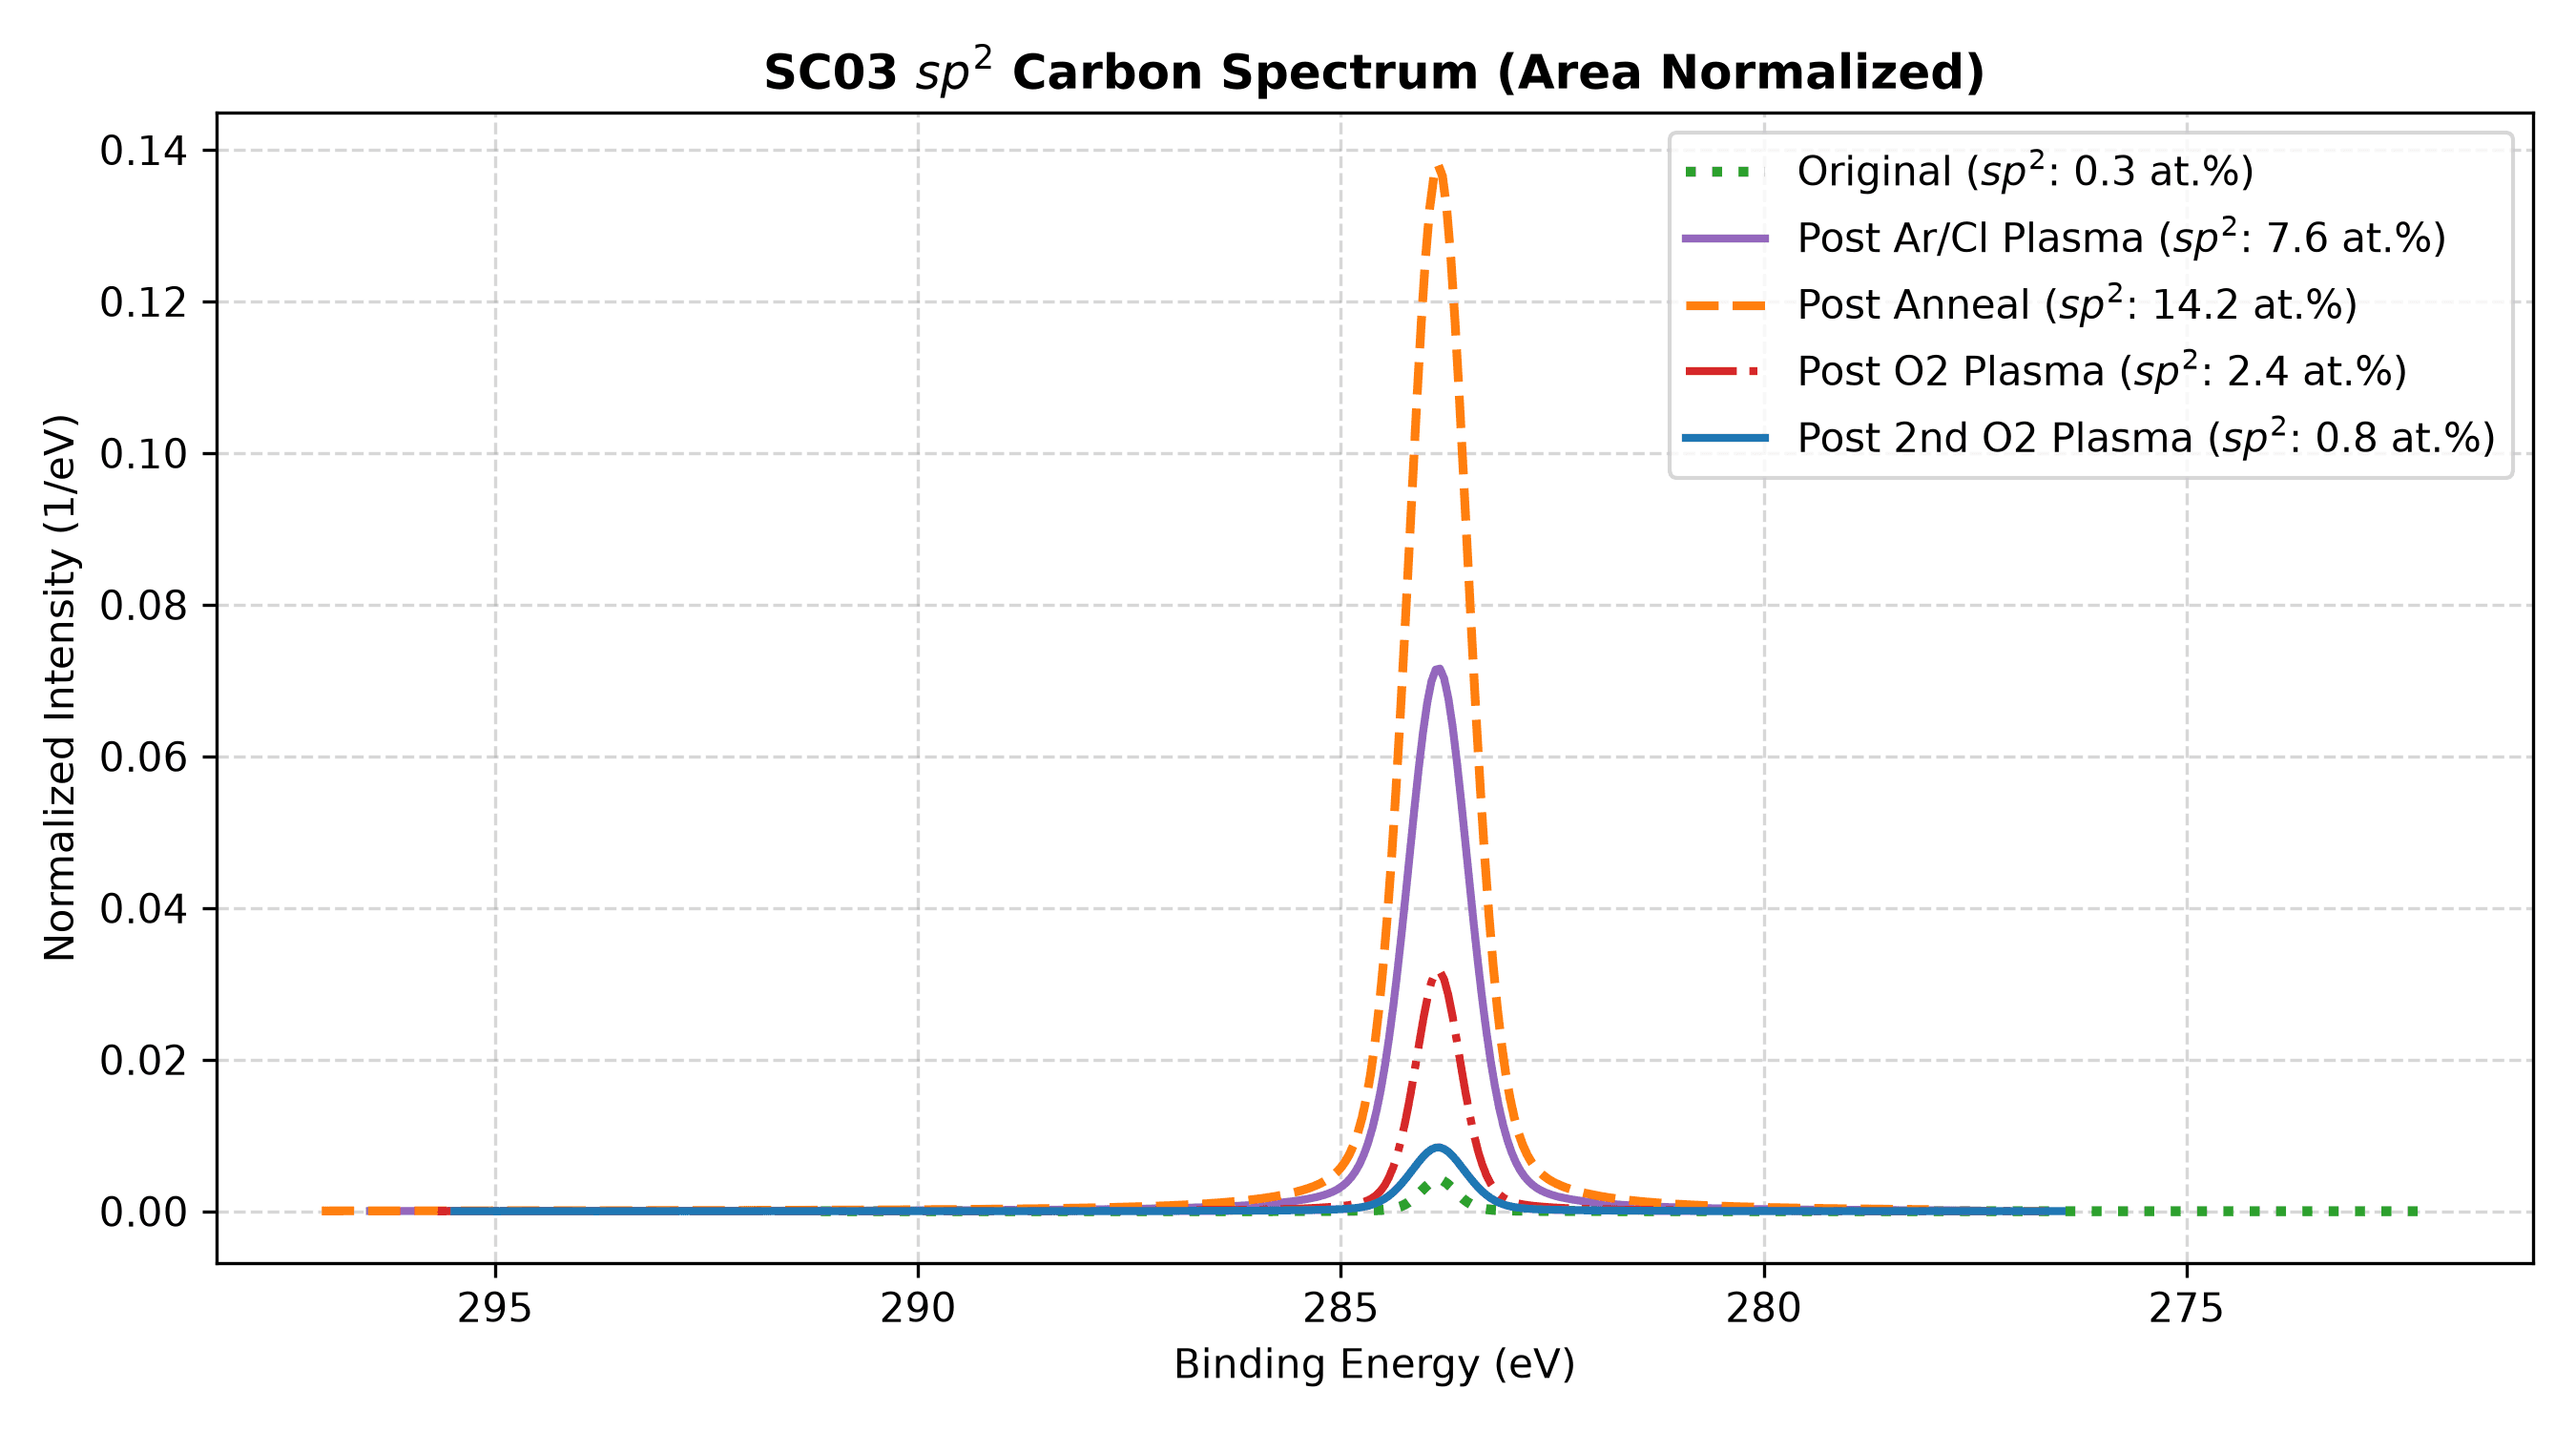
Area-normalized C1s sp² carbon spectrum for sample SC03 demonstrating the surface evolution through Ar/Cl plasma, anneal, and successive O₂ plasma treatments.
Discussion
High-temperature annealing consistently generates an unwanted graphitic carbon layer across all diamond surfaces. While the Triacid results from SC01 and SC02 demonstrate that acid cleaning removes a portion of this material, the process remains incomplete, as neither sample returned to its original baseline. In contrast, the subsequent O₂ plasma treatment produced a substantially larger improvement, dropping fitted sp² concentrations to approximately 1.73% for SC01 and 3.42% for SC02 while simultaneously lowering their D-Parameters back to ~14.0 eV and ~14.5 eV. These values closely mirror the pristine starting surfaces, proving that O₂ plasma is significantly more effective than traditional Triacid cleaning at removing residual graphitic contamination.
The second batch of diamonds (SC03–SC07) extended this result by showing that O₂ plasma cleaning achieves substantial surface restoration without requiring any preceding Triacid treatment. Across all five samples, D-Parameters dropped significantly following plasma exposure regardless of acid pretreatment. From a processing standpoint, this is a major fabrication milestone: if equivalent surface quality is achievable with O₂ plasma alone, the hazardous, multi-day Triacid step can be reduced or eliminated entirely from this stage of the diamond device workflow.
Overall, the results strongly support O₂ plasma cleaning as an effective method for removing anneal-induced graphitic contamination from E-grade diamond surfaces. Triacid cleaning clearly provides some benefit, but the dramatic improvement produced by the subsequent O₂ plasma treatment, combined with the successful cleaning of SC03–SC07 without any intermediate Triacid step, suggests that O₂ plasma is the more important process for restoring the surface.